
Loading...
Aracne
Studying painting canvases
Aracne is a digital tool that facilitates the analysis of the canvases that artists used for their paintings.
This software precisely and objectively characterises fabrics so that paintings can be compared and original formats and added layers studied.
After years of research and close cooperation between the Universidad de Sevilla and the Museo Nacional del Prado, Aracne has been launched as an open-access tool, in the belief that it will help experts to learn more about paintings.
We offer a version for Microsoft Windows. This version has been tested with Microsoft Windows 11, although it should also work on earlier versions of this operating system. Before installing and using the software, please follow these steps:
- Save and unzip the .exe file in a folder.
- Install MCR v9.9 from MATLAB®
Version 3.2.5, released in April 2026, solves some known issues and introduce some improvements, among others:
- A better processing of the image that further remove noise
- Smaller processing window, under the 1 cm side of version 3.2.0, improving resolution
- Avoiding alpha or transparency channels in the gray scale image
Thank you for your interest in Aracne. Please feel free to contact us at murillo@us.es to let us know about your interest in Aracne. Also, you can write to us to comment on your experience with this software, it will undoubtedly help us improve it.
Why Aracne?
Observing the original canvas
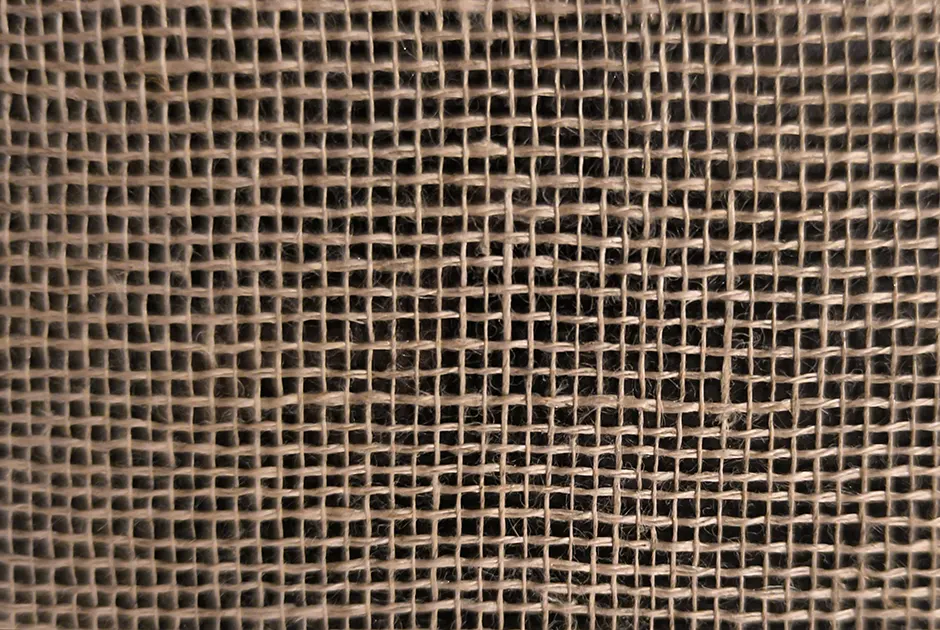
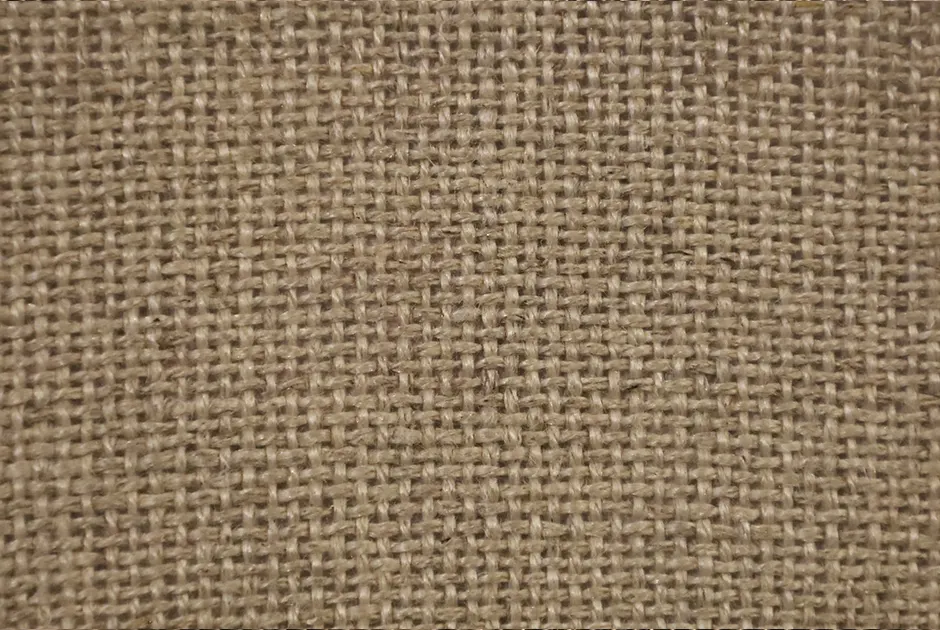
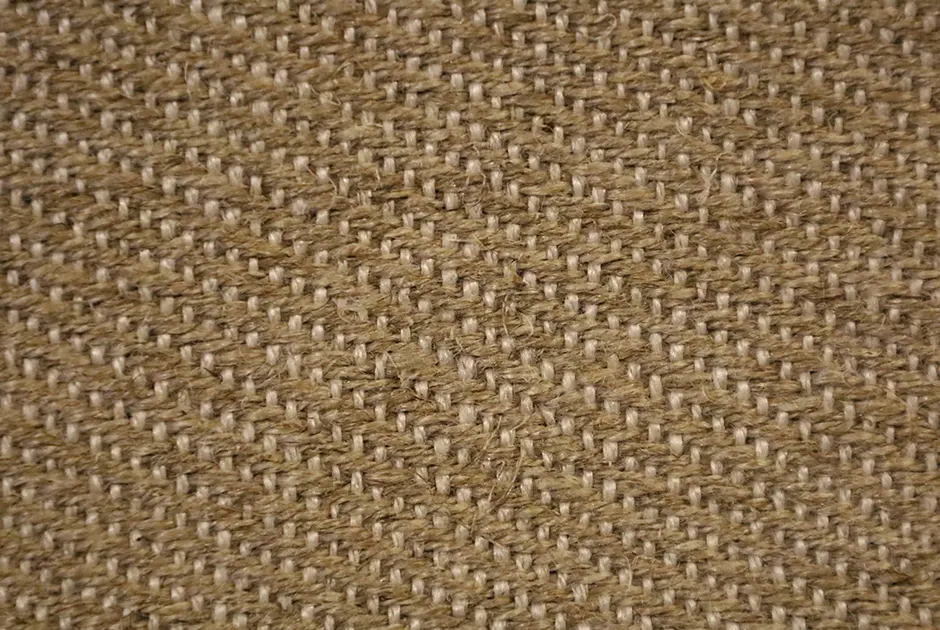
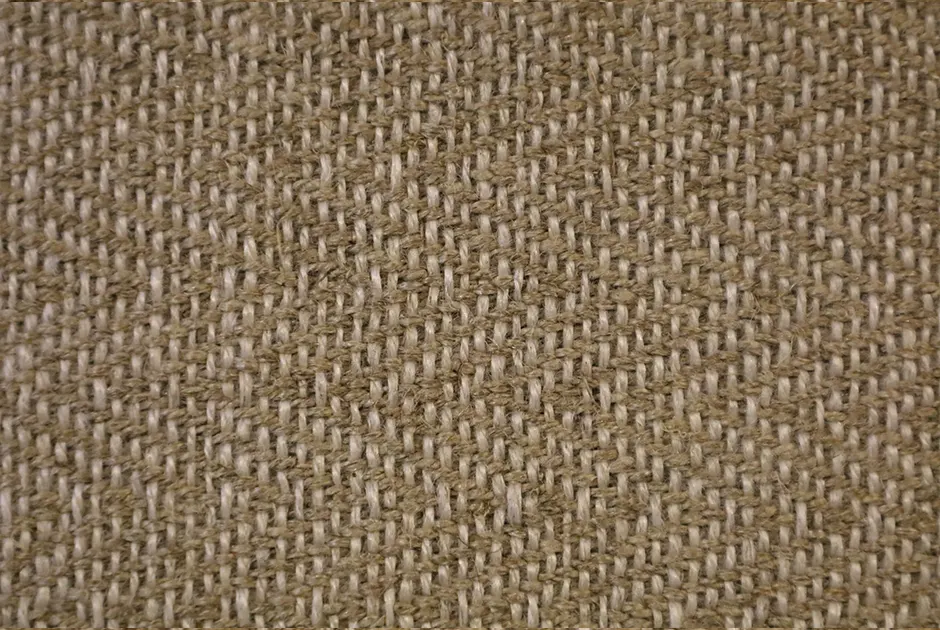
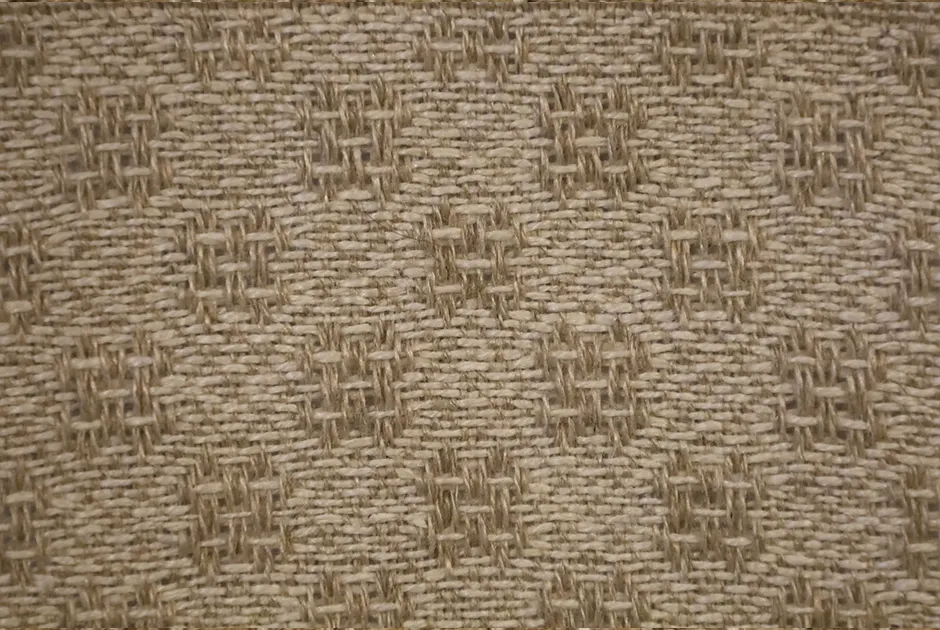
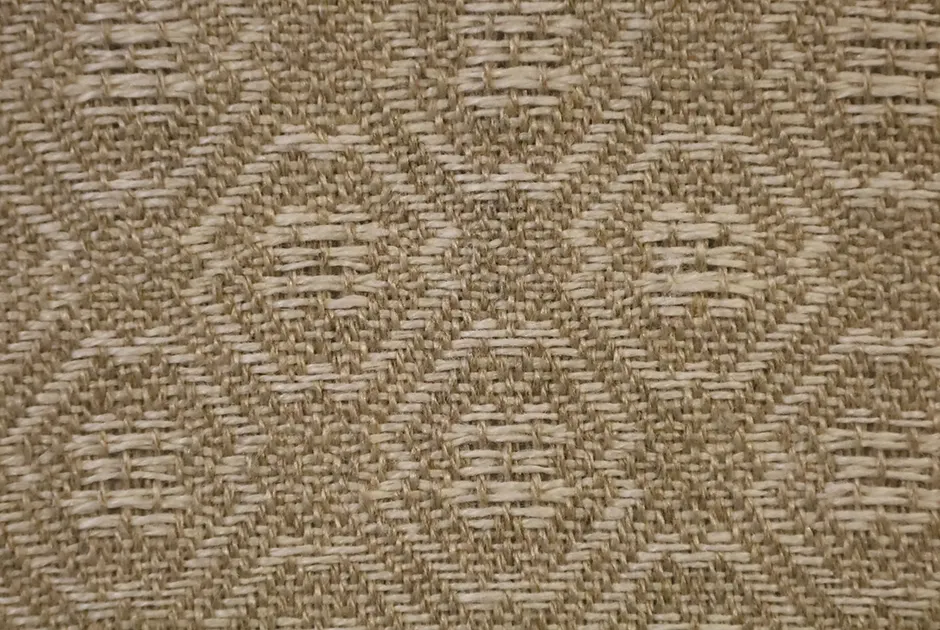
In the seventeenth century, textiles became the widely preferred pictorial support surface, replacing the wooden panels of earlier eras. At first, artists had to rely on textiles made for other purposes, such as tablecloths, sailcloth, tents, mattress covers and household linens. These canvases were made by hand and used different patterns, some of which were quite complex and beautiful.
However, when we look at the back of an old painting today, it is hard to see the original fabric because so many works have been lined, a conservation process that consists in adhering a new piece of cloth to the back of a canvas, strengthening but also concealing the underlying textile. Lining paintings on canvas has been common practice in every country for centuries, but more so in Spain due to one specific and momentous historical event: the fire that destroyed the Real Alcázar of Madrid on Christmas 1734, during the reign of Philip V. The flames spread so quickly that they consumed not only the palace but also numerous artworks in the royal collection. Many of the canvases were cut out of their frames and rolled up to make them easier to carry out of the building. This tragedy decisively influenced the history of restoration work in Spain, as a large number of the rescued paintings had to be lined so that they could be pulled taut on stretchers and displayed once again. As a result, the original canvas used by the painter cannot be seen on the majority of the works that were in the Spanish royal collection.
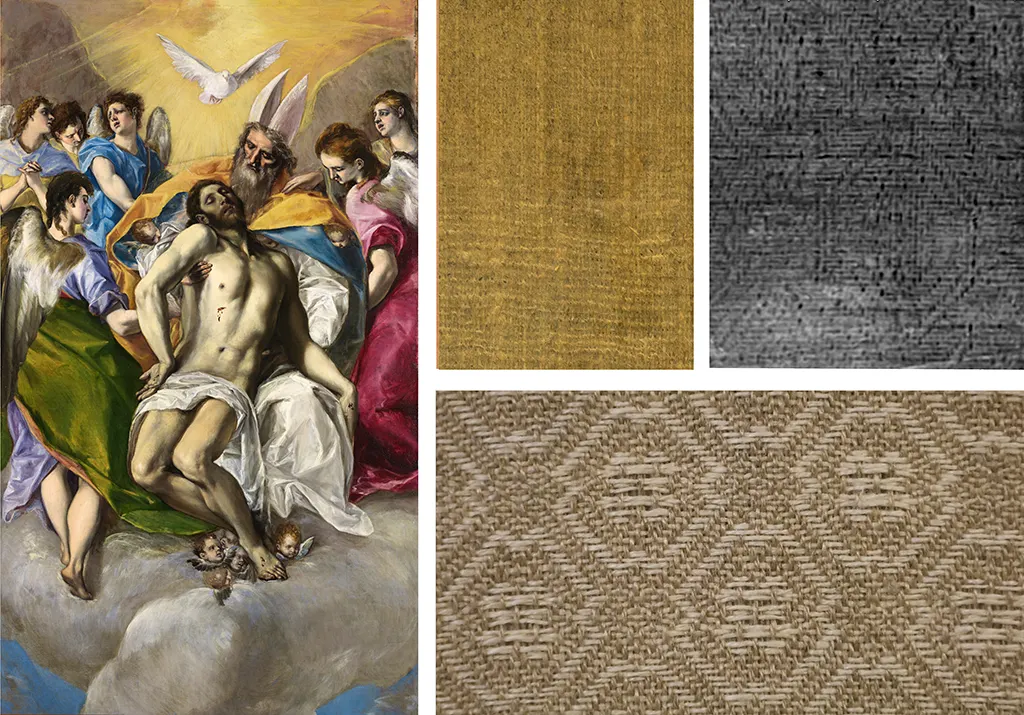
X-rays of these lined paintings fill in the blanks and provide precise information on the original textile support surfaces, even when they are no longer accessible. This technology reveals that in Spain, as in Italy, France, England, Portugal and the Netherlands, artists mostly chose plain-weave fabrics, although the thread count of canvases does vary. It also shows that some painters resorted to richer twill weaves, such as ticking, herringbone, diamond or tablecloth Great Spanish artists like Velázquez, Murillo and Goya, Italian masters such as Titian, Tintoretto and Bassano, and Flemish painters like Rubens and Van Dyck chose incredibly beautiful fabrics for some of their masterpieces.
Tityus, José de Ribera
Equestrian Portrait of the Duke of Lerma, Rubens
The Abduction of Helen, Tintoretto
The Animals entering Noah’s Ark, Jacopo Bassano
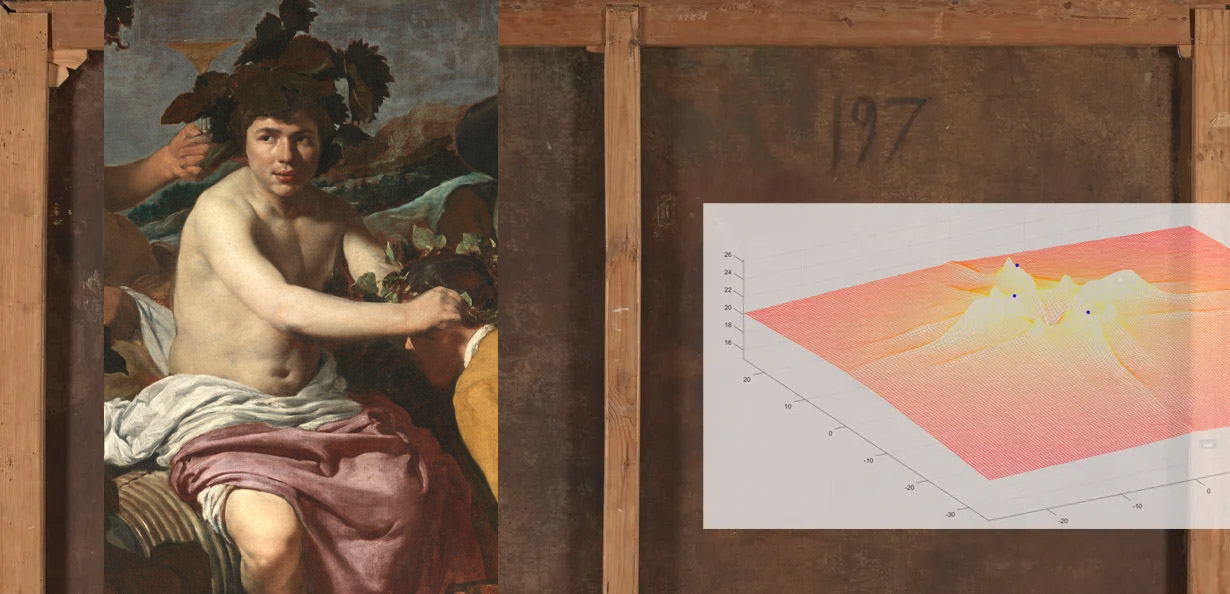
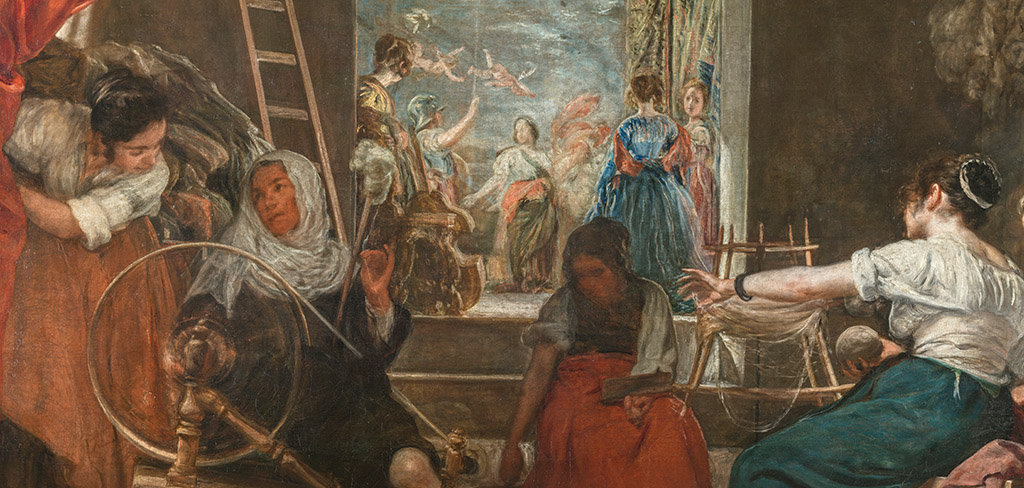
The Adoration of the Magi, Velázquez
The Holy Trinity, El Greco
Project background
In 2004, Laura Alba joined the imaging technology department at the Prado, specialising in X-ray imaging. One of her jobs was to characterise the canvases of paintings, and the data she had to record included thread count, the number of vertical and horizontal threads in one square centimetre of fabric. These data make it possible to describe and compare the fabrics used by different painters. At the time, this number was obtained using a thread counter, a small magnifying glass with a ruler marked in mm for measuring one square centimetre, placed directly on the back of the original canvas or, in the case of the many lined works in the Prado’s collection, over an X-ray.
The final thread count was calculated by averaging the number of threads counted in different areas on the canvas. However, the count for the same painting often varied significantly depending on how many times and where the measurements were taken. For this reason, Laura began reading publications and contacted European and American colleagues who might be having the same problem. In this way, she learned about the work being done by a team of researchers at Cornell University in Ithaca, New York, who had developed software capable of counting the threads in an entire canvas and obtaining statistical values from those measurements. Unfortunately, at the time this software was not available to users, so the Museo del Prado was unable to conduct a systematic study of its canvases.
In 2012, a mathematician and physicist named Ingrid Daubechies, from Duke University in Durham, North Carolina, who was also a member of that research group, travelled to Madrid to receive a Frontiers of Knowledge Award from the BBVA Foundation. While she was there, she visited the Museo del Prado and met with Laura to talk about how mathematical data and signal processing could be applied to technical imagining and, more specifically, X-rays of works of art. Ingrid encouraged her to develop her own thread counting program and to contact, via Professor Pérez-Cruz, the (Signal Theory and Communications Department of the Engineering School ) at the Universidad de Sevilla.
Thus, in 2013 studying the canvases of easel paintings became one of the principal lines of research in the Prado’s technical area, and Doctor Juan José Murillo Fuentes from the Universidad de Sevilla and Doctor Laura Alba Carcelén of the Museo del Prado embarked on a collaborative journey. The aim of their partnership was to develop a software which they dubbed ‘Aracne’. Today, after over a decade of hard work, Aracne has become an integral part of the methodology of technical analysis applied to artworks at the Museo del Prado.
Desarrollo del software
At the dawn of the twenty-first century, some researchers in the signal processing community came up with the idea of using frequency analysis to characterise industrially manufactured fabrics (Escofet, Millán and Ralló, 2001). This analysis entailed calculating a Fourier transform (FT) for the entire surface by means of small square windows, normally 1 to 2 cm wide. Years later, the method was adapted for counting threads in pictorial canvases from digital X-ray images of the works (C.R. Johnson, D.H. Johnson, R. G. Edrmann, 2011).
The Signal Theory and Communications Department of the Engineering School at the Universidad de Sevilla, in partnership with the Museo del Prado, has developed a software program called Aracne that uses the above-described frequency analysis to automate the thread counting process. This software is intended to improve and adapt the latest advances in frequency analysis to the needs of our field.
Within the scope of frequency analysis, Aracne specifically uses power spectral density (PSD) analysis to characterise fabrics (Simois, y Murillo, 2018). PSD is a robust tool that obtains results even on fabric in poor condition or from unsharp X-ray images. It is also highly effective at distinguishing between textiles with similar thread counts and very capable of characterising twill-weave fabrics.
Aracne is a product of the collaborative efforts of Laura Alba Carcelén at the Museo Nacional del Prado and Juan José Murillo Fuentes at the Universidad de Sevilla, where the software was developed. From the beginning and until Aracne’s launch, Juan José Murillo supervised the design and development of the software and was actively involved in the coding and testing phases. During this period, he was assisted by colleagues and students whose support was vital to the development process. Chief among them were Professor Irene Fondón, who played a key role in the initial design of the graphic interface, and Professor Francisco Simois, who developed theoretical studies that were immensely helpful during development. Marta Ternero Gutiérrez, Pablo Aguilera Bonet and the student Lucía Córdoba Saborido helped to debug the code.
The initiative received no funding; in other words, it was not conducted under the aegis of a research project or contract. The Museo Nacional del Prado, represented by Laura Alba Carcelén, saw a need for this program and was involved in supervising its design from the user’s perspective, checking that Aracne worked properly. The case studies provided by Dr Alba, some of which are quite complex, were decisive in Aracne’s evolution.
The software’s name comes from the fable told by Ovid in the sixth book of his Metamorphoses. In it we read that Arachne, a mortal woman and skilled weaver, challenged Pallas Athena, goddess of handicraft and wisdom, to a contest. Each had to weave a tapestry in order to determine who was the better weaver. Athena’s tapestry displayed the glories of the gods, while Arachne’s showed their sins. Enraged at the mortal woman’s choice of theme and perfect work, the goddess turned Arachne into a spider.
How to use Aracne
The Aracne software automatically counts the threads in a piece of fabric, regardless of its use or provenance. The Museo del Prado uses it to characterise the canvases that painters have used as supports. For this reason, it was designed specifically to analyse the types of textile support most frequently used in easel painting: plain weave and twill weave with simple patterns.
In order for Aracne to run an analysis, it needs an image. If the original fabric is visible on the back of the painting, a photograph will suffice, but if the work has been lined, an X-ray of the original support surface is needed. In either case, the image must be the same size as the original (1:1 scale) and taken in greyscale.
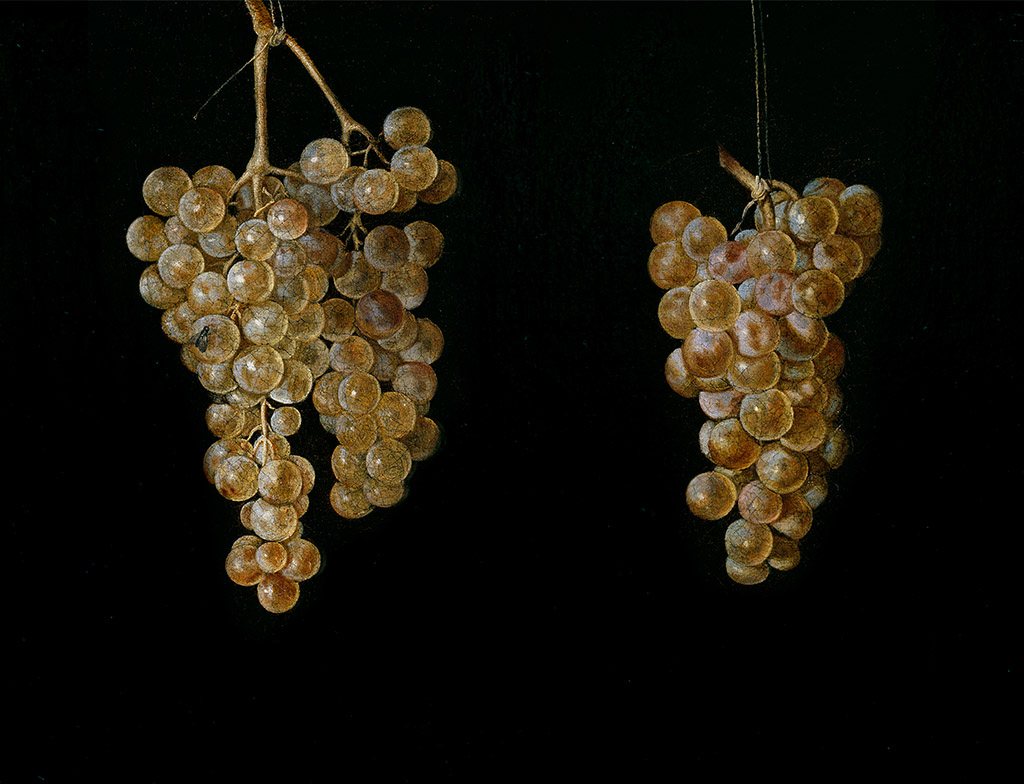
Aracne is easy to use, but a certain amount of knowledge and experience is required to interpret the results and images. To show how it can be used to study a painting, we will use a small canvas from the Museo del Prado’s collection as an example: Two Bunches of Grapes with a Fly, dated to between 1630 and 1644 and attributed to Miguel del Pret, a Spanish painter of Flemish descent.
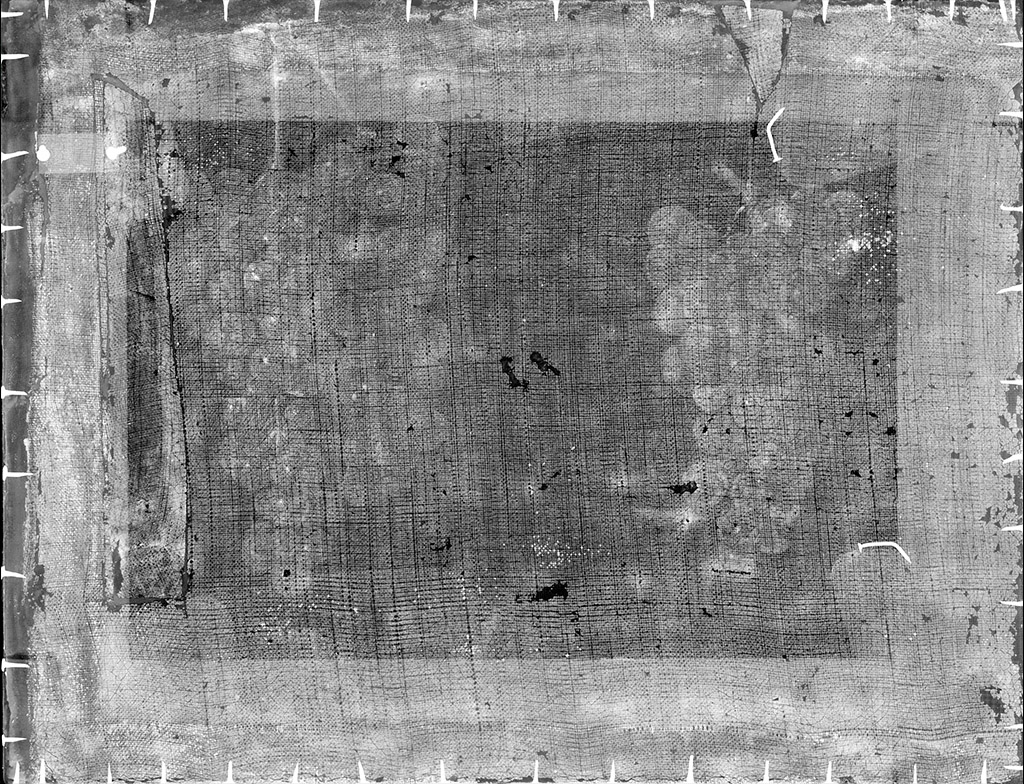
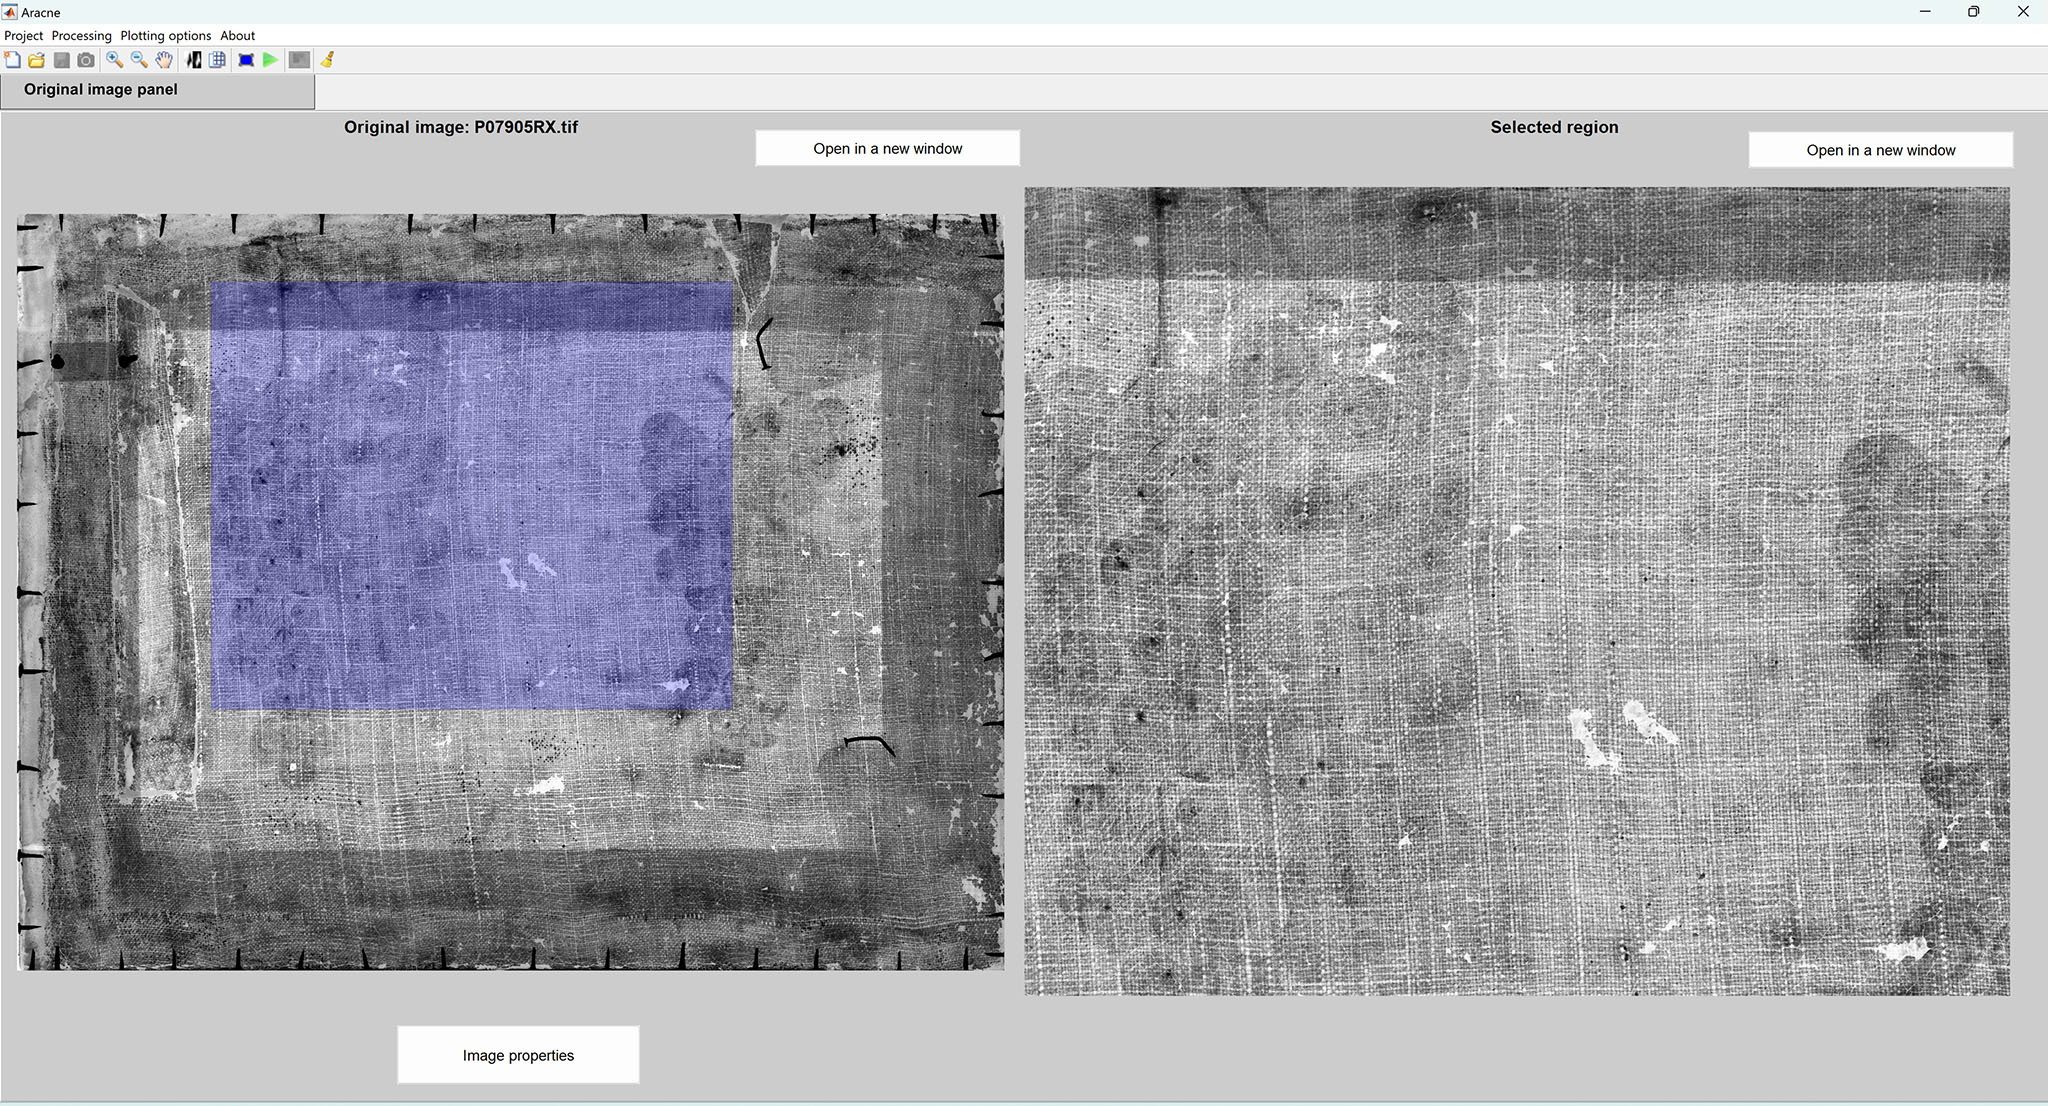
The first step is to prepare the image, in this case an X-ray because the work has been lined. We then open Aracne, load the image and select the area we want to process, which can be complete or partial if we are only interested in a particular section. The software lets us zoom in on the selected area and invert blacks and whites to get a better view of the threads. We can also place a grid over the image to obtain an initial visual thread count that will be useful when setting parameters.
The frequency analysis is designed with a set of parameters, which have default processing values that can be modified if necessary. In general, higher-resolution results require more computational load, which means a longer processing time. Once these values are established, we run the analysis.
A study based on frequency analysis is conducted around every point in the selected area. Based on this study and for that specific point, the program determines the density of horizontal and vertical threads and their deviation in degrees from the horizontal and vertical axes, respectively.
After analysing the entire selected area, a new screen opens with three main tabs: ‘Original image’, ‘Thread counting’ and ‘Power spectral density’. These tabs present different data, images and graphs with the thread count results.
The ‘Thread counting’ tab displays maps of the vertical and horizontal counts represented as images and statistical values (mode, mean and standard deviation). The image on the left side shows the thread count obtained in each area of the painting, with a colour key to indicate the frequency of threads per centimetre. In this case, we see the count obtained for vertical threads, although a submenu within the tab allows us to see the horizontal thread count and angle deviations. The software also lets us overlap these images on the originals, so that we can identify the areas of the painting where the count deviates from the average, as might be the case of canvases with different fabric panels, grafts or additions.
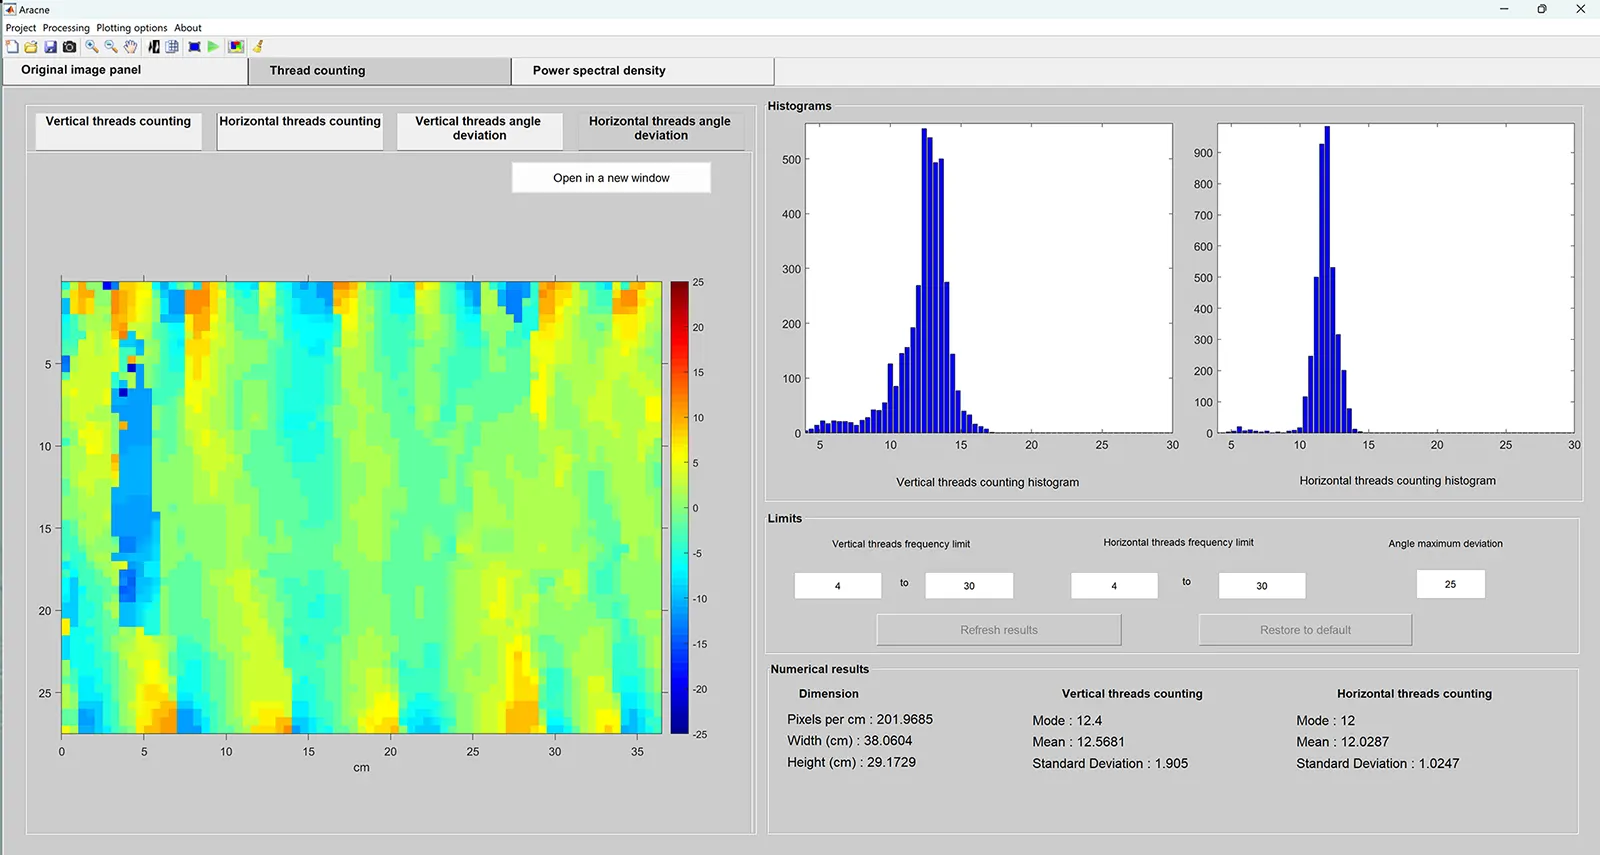
The right side of the same screen contains the normalized histograms, which represent the probability density function for each frequency of vertical and horizontal threads. These figures reflect the number of times a certain count (i.e., a given number of threads per centimetre) was found in the painting. This result is directly related to the thread count map. On this vertical thread count map, we can see that in the lower region of the left side of the figure, the predominant value is around 13 threads per centimetre. These are the most frequent values and, as such, the ones that appear the highest on the vertical thread histogram.
The deviation maps for vertical and horizontal threads, in image form, show the analysis of thread deviation in degrees performed on the Museo del Prado painting. Aracne generates maps that show the deviation of vertical threads from the vertical axis and of horizontal threads from the horizontal, with a key illustrating the colours that correspond to different degrees of deviation.
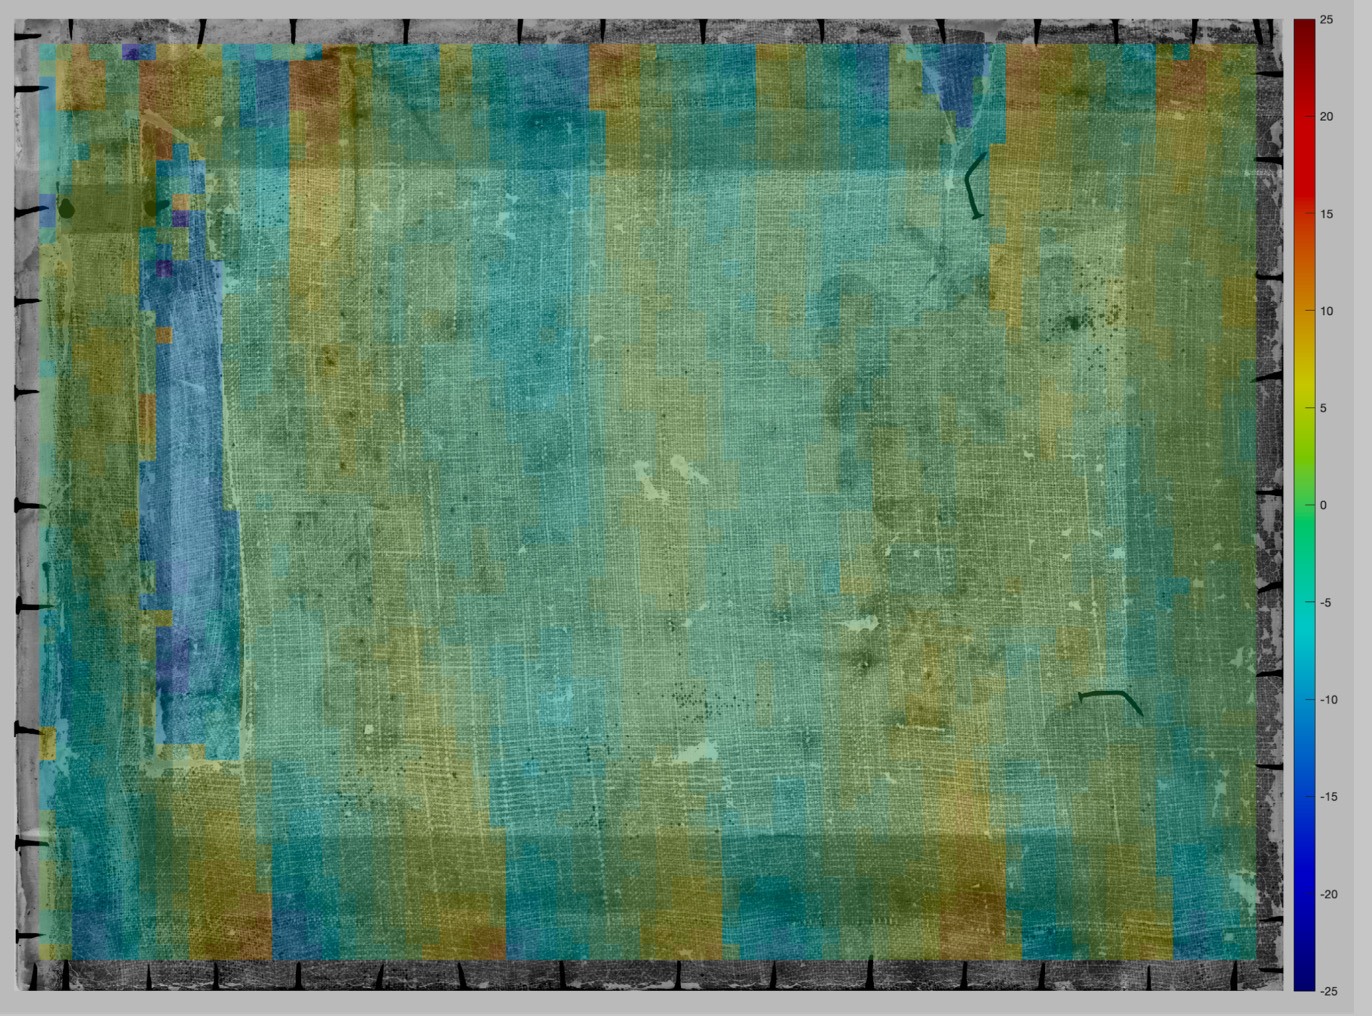
Positive angles are clockwise deviations. In the case of Two Bunches of Grapes with a Fly, we see that most regions of the painting have deviations of ± 5°. However, on the left side, there is an elongated section with a significant variation, identified as a graft of a different fabric. Deviation maps are useful for studying how threads are distorted by tension when a canvas is mounted on a stretcher. On this painting, such distortions are only visible along the top and bottom edges.
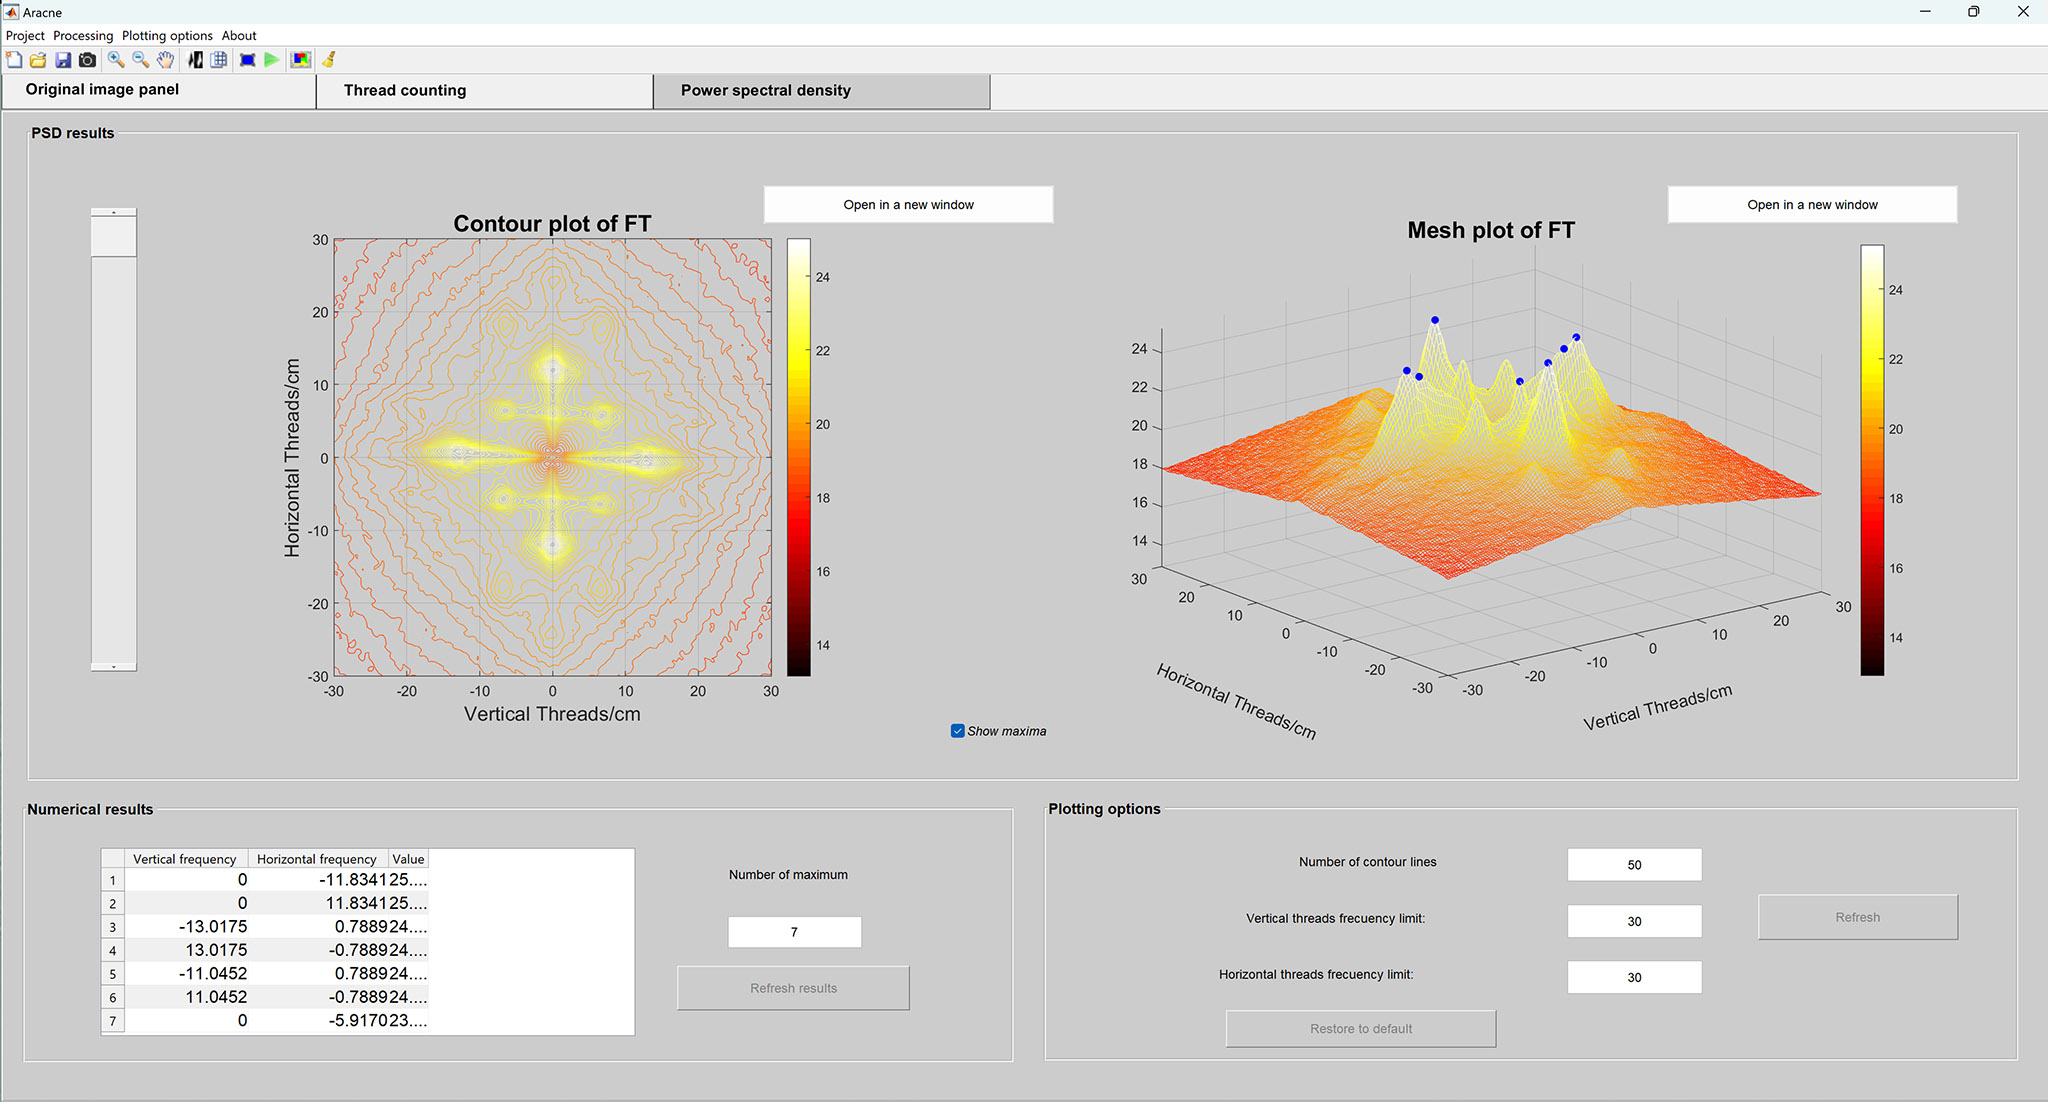
Finally, the last tab at the top, ‘Power spectral density’, includes the results of the PSD, the combined analysis of all studies done on every area. This is a single piece of data for the entire picture that tells us what the fabric is like. The PSD can be depicted as a contour plot, as cuts of the resulting function, or as a function in three dimensions. The left side of the screen shows an overhead view with contour lines of the function, depicted in 3D on the right side. This result gives us a clear vision of the location of the maximum values of the horizontal and vertical thread counts and others that should theoretically be present in an ideal fabric.
Together, these maps, graphs and data help to characterise and describe a fabric in a precise and reliable way. The validity of these results means they can be compared and contrasted with those obtained by other means in order to identify possible similarities. Over the last decade, thread count maps have been used to compare pictorial supports and determine if separate canvases came from the same bolt of cloth. If fabrics are found to have the same provenance, this means they must have been made in roughly the same place and around the same time. They should be a very close match, and correctly interpreting results is of paramount importance.
Recursos
Citing Aracne
To cite the Aracne software, please include the following:
- J. J. Murillo-Fuentes, Irene Fondón-García, Marta Ternero Gutiérrez, P. Aguilera-Bonet, Lucía Córdoba Saborido, Francisco Simois Tirado. ‘ARACNE, A software tool for thread counting in X-rays of fabrics.’
- F. J. Simois-Tirado, J. J. Murillo-Fuentes, ‘On the power spectral density applied to the analysis of old canvases.’ Signal Processing. 2017. Vol. 143, pp. 253–268.
Case studies
Rubens and his copies of Titian’s works: Using thread count maps
Speaking of Rubens’s activity during his second visit to Madrid, from September 1628 to April 1629, Francisco Pacheco wrote, ‘It seems incredible that he should have painted so much in so short a time and amidst so many occupations.’ Among the works painted by Rubens in that time, he mentions ‘five or six portraits’ of ‘private individuals’ and claims that he also ‘copied everything by Titian in the king’s possession’. Considering that the Spanish royal collection contained over fifty Titians at the time, it is unlikely that Rubens was able to create full-scale copies of them all.
The Prado owns two of Rubens’s copies of originals by Titian, Adam and Eve and The Rape of Europa, which have been analysed to determine whether they were painted during his stay in Madrid, as Pacheco maintained, or at his home/workshop in Antwerp upon returning from Spain.
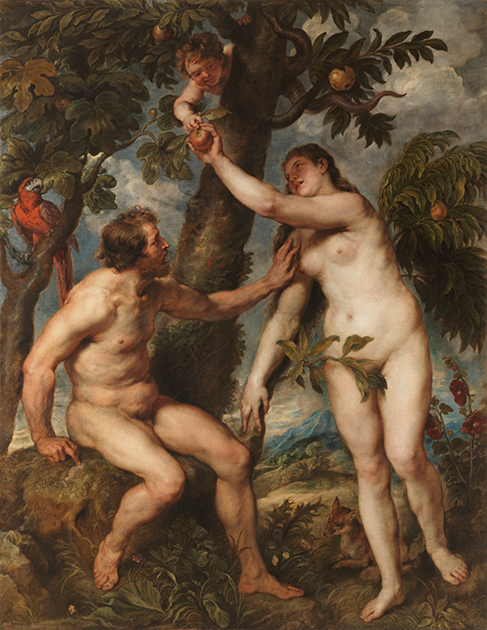
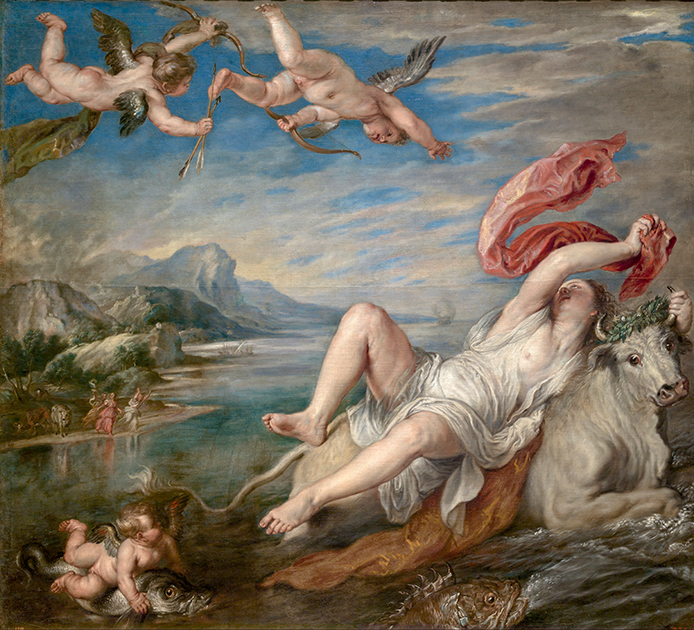
Materials analysis had confirmed that Adam and Eve was painted in Madrid during Rubens’s trip to Spain in 1628. However, the results of tests on The Rape of Europa were inconclusive, and it was decided that Aracne should be used to compare the canvases of both works.
The histograms and thread count maps proved particularly useful in this case, allowing us to prove that the same fabric was used for both paintings, although one is rotated in relation to the other. The fact that the two scenes were painted on two pieces of canvas cut consecutively from the same cloth confirms that Rubens made both in Madrid.
The following image shows the histograms with the vertical (left) and horizontal (right) thread counts of the two works, Adam and Eve above and The Rape of Europa below. The statistical results, mean and mode, of these estimations are displayed to the right of the histograms.
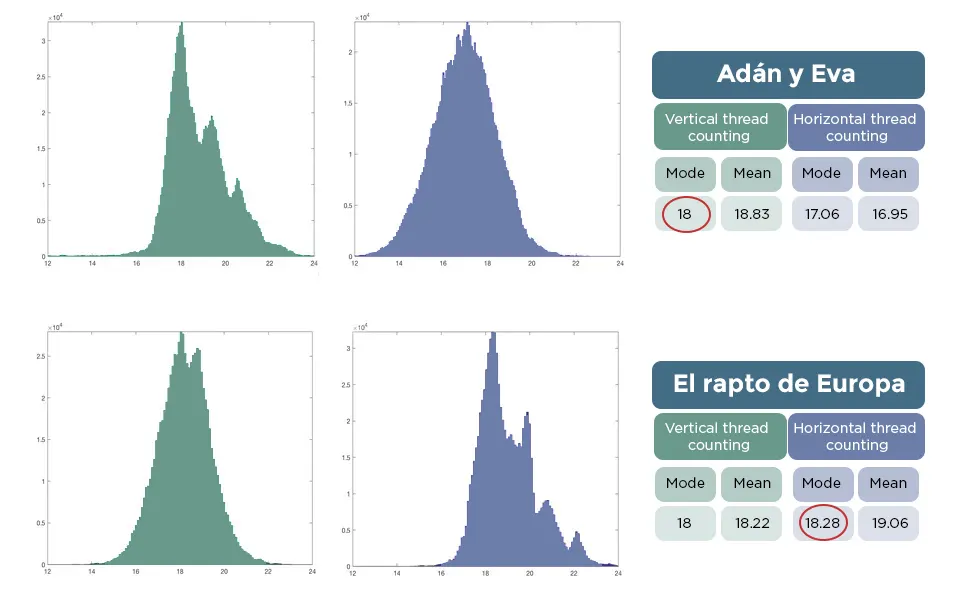
The weft tends to look like a Gaussian curve, because the weaver tenses the thread differently every time it passes from side to side. But the arrangement of the warp is decisive and depends on how the threads are tied onto the loom. The upper left histogram is similar to the lower right one; in both cases, we see concentrations of densities at around three or four, with the highest values being 18 and 18.28, respectively. This tells us that the vertical warp threads in Adam and Eve match the horizontal threads in The Rape of Europa. This coincidence proves that the two fabrics are related, which is also confirmed when we compare the distribution of densities on the thread count maps.
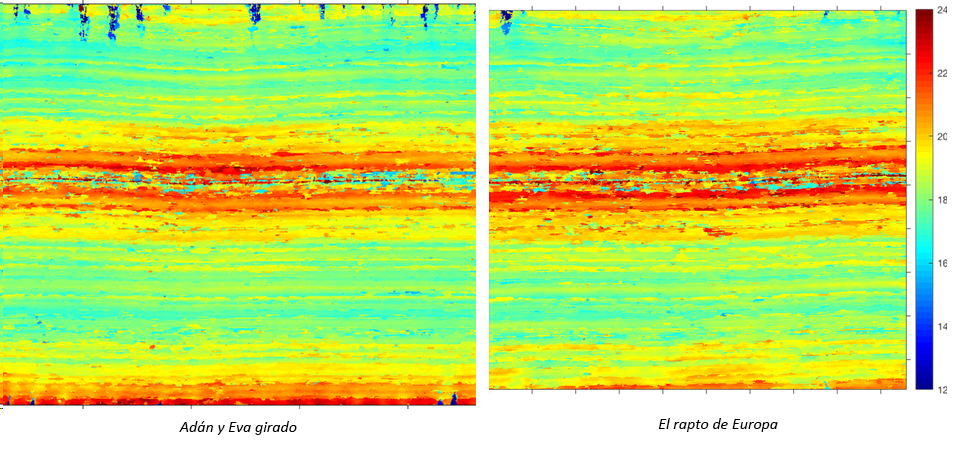
The image shows that thread density matches across the support surface, varying identically along the length of the warp and weft of both paintings, although Adam and Eve is rotated 90º so that its vertical threads align with the horizontal threads in The Rape of Europa. In both cases, we can see that the artist used two pieces of fabric sewn together in the middle. Thread count is higher on the outer edges of the canvas than in the central part.
The results of this study were published in 'Rubens en Madrid (1628-29): nuevos datos técnicos sobre sus copias de Tiziano y un nuevo retrato'.
The Atenea project
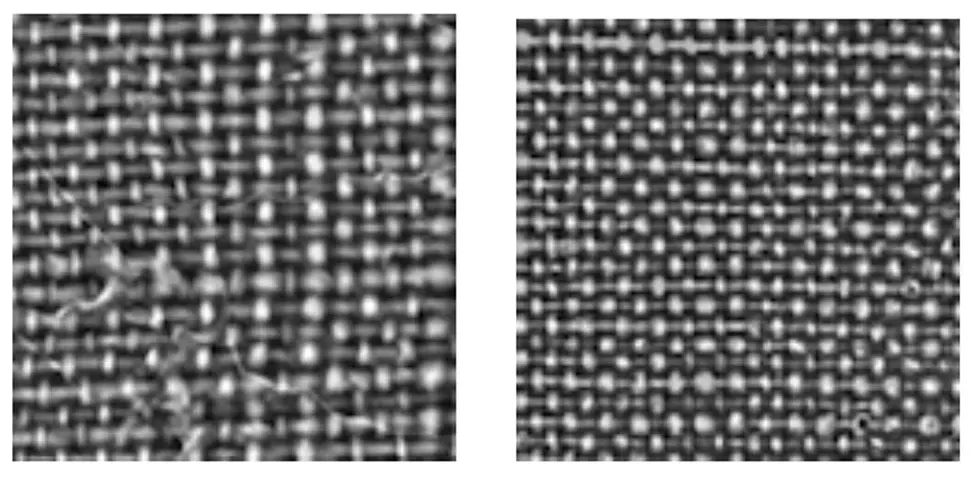
Over the years, we found that frequency analysis failed in a wide variety of situations. In fact, while studying the canvases used in the works attributed to Velázquez at the Museo del Prado, we discovered that Aracne’s results were unsatisfactory. The problems appear when patterns are not uniform because the space between threads varies significantly within a centimetre, or because the threads in one direction are so taut that it is hard to observe the threads in the other. The following figure contains examples of these two scenarios.
To address this issue, we developed tools based on artificial intelligence. In the frequency domain, with Aracne, we seek maximum values in the Fourier transform. In this case, we work in the spatial domain, focusing on the image itself. First, we developed a method (Bejarano, J. Murillo-Fuentes and L. Alba-Carcelén 2022a; Bejarano, J. Murillo-Fuentes and L. Alba-Carcelén 2022b; Delgado, Laura Alba-Carcelén and J. J. Murillo-Fuentes 2023) to segment intersections and later estimate the space between them. The figure below shows how, after preprocessing, a deep learning model is used to detect the intersection points. Finally, a simple approach is used to translate the distance between intersections into vertical densities.
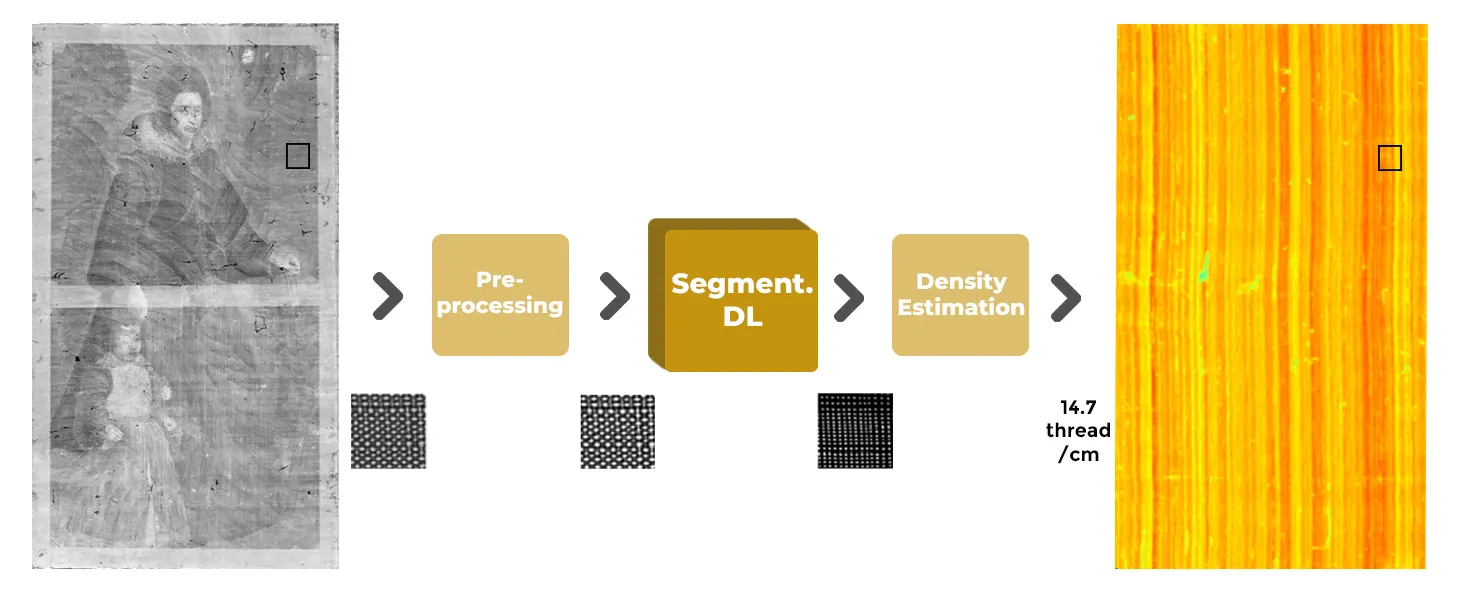
In a second approach, we estimated thread count directly from the image. After preprocessing, we applied a deep-learning regression model to obtain the vertical thread density (Delgado, J. Murillo-Fuentes and L. Alba-Carcelén 2023,Crossing points detection in plain weave for old paintings with deep learning)
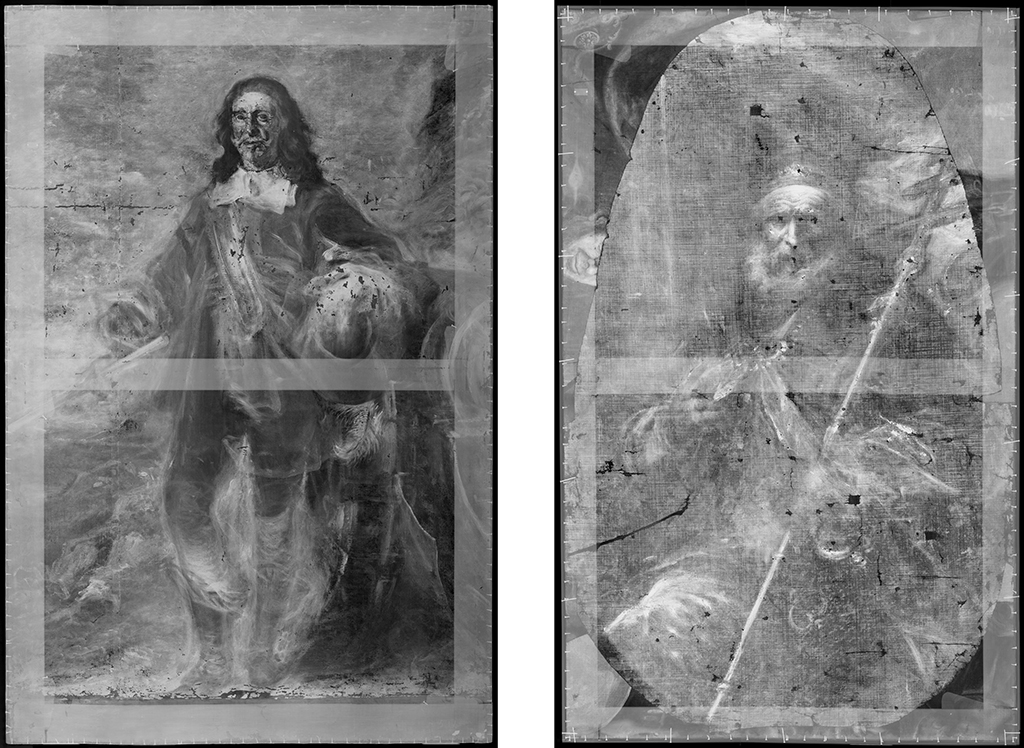
The Atenea project has proved quite useful for analysing canvases with the aforementioned characteristics. Below are the radiographs of two canvases: An Artillery General, formerly attributed to Francisco Rizi, on the left; and on the right, Saint Peter as Pope, painted by Francisco Herrera the Younger.
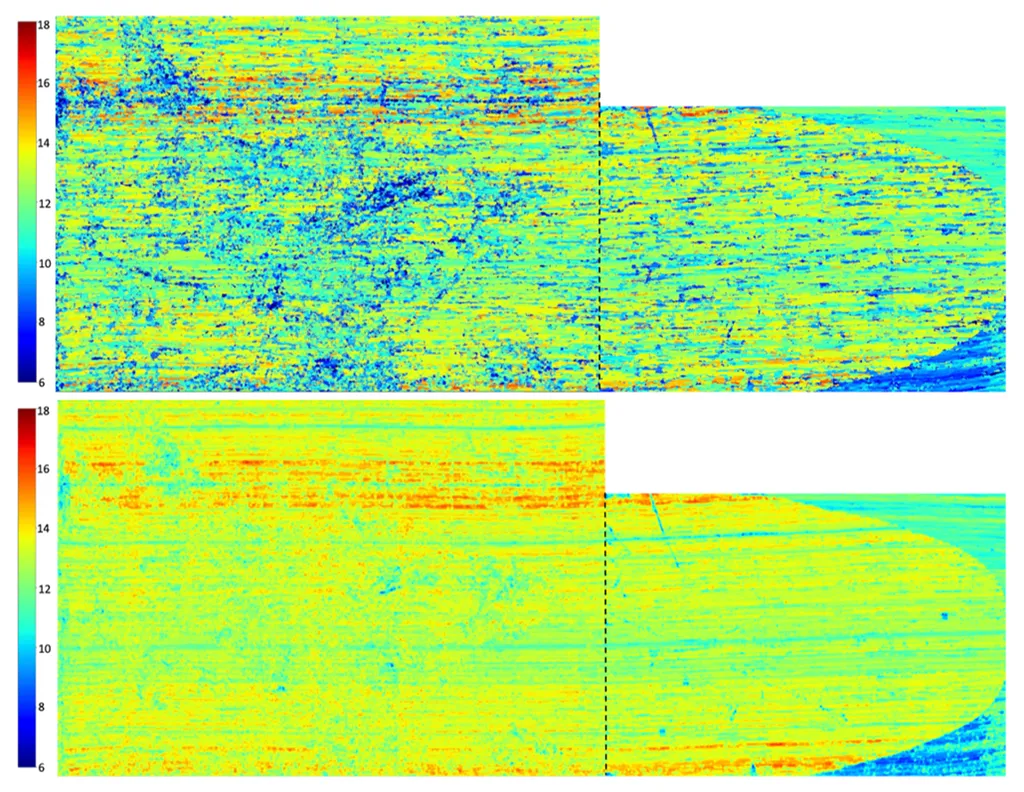
The next figure contains the vertical thread count maps for both works rotated 90º: above, the results with frequency analysis (FT), and below, the results with deep-learning regression (Atenea project). The distribution of threads across the entire canvas is easier to observe in the results obtained with Atenea. The fact that the thread count maps of both canvases matched was one of the reasons why their authorship was revisited and both were finally attributed to Francisco Herrera the Younger.
The Atenea project was funded by the Regional Ministry of Economy and Knowledge, Junta de Andalucía, and by the European Union within the framework of the Andalusia ERDF 2014–2020 programme ‘Crecimiento inteligente: una economía basada en el conocimiento y la innovación’ to finance this research as part of the Atenea project P20-01216.
Literature related to its application
Development of the Aracne software
- Mar Velasco, Juan José Murillo-Fuentes and Laura Alba-Carcelén (Sept. 2022). ‘Complex Twill Fabrics Pattern Recognition in Canvases.’ In 7th IP4AI Meeting: Computational approaches for technical imaging in cultural heritage. National Gallery.
- Carcelén, Laura Alba and Juan José Murillo-Fuentes (2021). ‘Fabrics as a Painting Support: New Tools for their Study.’ In La Ciencia y el Arte: Ciencias experimentales y conservación del patrimonio histórico. 7. La Ciencia y el Arte VII: Ciencias experimentales y conservación del patrimonio. Ministerio de Cultura y Deporte, pp. 219–230. ISBN: 978-84-8181-760-7.
- Murillo-Fuentes, J. J. and L. Alba (2018). ‘Thread Counting in X-Rays of Plain-Weave Painting Canvas.’ In Advanced Characterization Techniques, Diagnostic Tools and Evaluation Methods in Heritage Science. Springer, pp. 91–105.
- Simois, Francisco J. and Juan José Murillo-Fuentes (2018). ‘On the power spectral density applied to the analysis of old canvases’. In Signal Processing 143, pp. 253–268. ISSN: 0165-1684. DOI: https://doi.org/10.1016/j.sigpro.2017.08.006. URL: https://www.sciencedirect.com/science/article/pii/S0165168417302888.
- Murillo-Fuentes, J. J., I. Fondón, L. Córdoba, P. Aguilera, F. J. Simois (2016). ‘ARACNE, A software tool for thread counting in X-rays of fabrics.’ Registro Territorial de la Propiedad Intelectual de Andalucía. SE-227-16.
- Fondón-García, I., F. J. Simois and J. J. Murillo-Fuentes (June 2014). ‘Software tool for thread counting in X-rays of plain-weave painting canvas.’ In Conf. on Non-destructive Investigations and Microanalysis for Diagnostics and Conservation of Cultural and Environmental Heritage (ART2014), IND119.
Application to the analysis of easel paintings
- Jover, L. Gayo and L. Alba (2019). ‘Sofonisba Anguissola en el Museo del Prado. Una aproximación a su técnica.’ In Historia de dos pintoras: Sofonisba Anguissola y Lavinia Fontana. Museo Nacional del Prado.
- Alba, L. (2018). ‘El estudio de los soportes textiles a través de la radiografía. Los soportes españoles del siglo XVII.’ In La rivista del restauro 111–112, pp. 143–149.
- Vergara, L. Alba, L. Gayo and M. Jover (2017). ‘La elaboración en dos etapas del Meleagro y Atalanta de Jacob Jordaens en el Museo del Prado. Consideraciones técnicas.’ In Boletín del Museo del Prado 53, pp. 76–82.
- Aterido, A. and L. Alba (2013). ‘Juan Fernández el Labrador, Miguel de Pret y la “construcción” de la naturaleza muerta.’ In Boletín del Museo del Prado 31, p. 34.
- Vergara, A., L. Alba and L. Gayo (2013). ‘Rubens en Madrid (1628-29): nuevos datos técnicos sobre sus copias de Tiziano y un nuevo retrato.’ Boletín del Museo del Prado 31, p. 183.
Atenea project
- Delgado, A., Laura Alba-Carcelén and Juan J. Murillo-Fuentes (2023). ‘Crossing points detection in plain weave for old paintings with deep learning.’ In Engineering Applications of Artificial Intelligence 126, 107100 (12 pages). ISSN: 0952-1976. DOI: https://doi.org/10.1016/j.engappai.2023.107100. URL: https://www.sciencedirect.com/science/article/pii/S0952197623012848.
- Delgado, A., J. J. Murillo-Fuentes and L. Alba-Carcelén (2023). ‘Thread Counting in Plain Weave for Old Paintings Using Semi-Supervised Regression Deep Learning Models.’ https://arxiv.org/pdf/2303.15999.
- Bejarano, A. D., J. J. Murillo-Fuentes and L. Alba-Carcelén (Sept. 2022a). ‘Crossings segmentation in plain weaves for X-rays of canvases with deep learning.’ In 7th IP4AI Meeting: Computational approaches for technical imaging in cultural heritage. National Gallery.
- Bejarano, A. D., J. J. Murillo-Fuentes and L. Alba-Carcelén (Sept. 2022b). ‘Crossings segmentation in plain weaves for X-rays of canvases with deep learning: technical details.’ In 7th IP4AI Meeting: Computational approaches for technical imaging in cultural heritage. National Gallery.